Golang作为一门高效的语言,性能监控和调试非常重要,如何进行性能监控和分析是优化的关键。
Go语言项目中的性能优化主要有以下几个方面:
- CPU profile:报告程序的 CPU 使用情况,按照一定频率去采集应用程序在 CPU 和寄存器上面的数据
- Memory Profile(Heap Profile):报告程序的内存使用情况
- Block Profiling:报告 goroutines 不在运行状态的情况,可以用来分析和查找死锁等性能瓶颈
- Goroutine Profiling:报告 goroutines 的使用情况,有哪些 goroutine,它们的调用关系是怎样的
pprof介绍
go程序从开始运行起,runtime就按照一定频率对内存分配进行采样记录:当内存分配每达到一定值(默认是512KB,由runtime.MemProfileRate设定), runtime就会记录下当前这次内存分配的大小,call stack等信息到profile里面。
而CPU的profile是从调用runtime/pprof包的pprof.StartCPUProfile()开始,到pprof.StopCPUProfile()结束,每1秒采样100次,每次采样时记录下当前正在执行的所有goroutine的call stack,某个函数在这些快照里面出现的次数越多就说明这个函数越耗时。
运行的go程序的所有profile信息都是通过在运行时调用runtime/pprof和runtime/trace两个包的接口获取,调用这些接口的方式有直接调用和通过http请求间接调用两种,下面我们说明各种常用的profile信息以及它们的获取,使用方式。
pprof配置
pprof采集方式有2种:
pprof开启后,每隔一段时间(10ms)就会收集下当前的堆栈信息,获取格格函数占用的CPU以及内存资源;最后通过对这些采样数据进行分析,形成一个性能分析报告。
引入包
使用方法
1
2
3
| pprof.StartCPUProfile(w io.Writer) //开启,向一个io中写入cpu信息
pprof.WriteHeapProfile(w io.Writer) //向一个io中写入内存信息
pprof.StopCPUProfile() //停止,写入完成
|
命令模式
将数据写入到文件中
通过 go tool pprof [文件名] 命令查看使用
我们可以在交互界面输入top 10 来查看程序中占用CPU前10位的函数:
命令:
top 10
 1
 2
 3
 4
 5
 6
 7
 8
 9
10
11
12
13
14
15
16
17
18
19
20
21
22
23
24
25
26
|
[root@node61 ~]# go tool pprof http://10.151.11.61:39999/debug/pprof/profile?seconds=30
Fetching profile over HTTP from http://10.151.11.61:39999/debug/pprof/profile?seconds=30
Saved profile in /root/pprof/pprof.kube-batch.samples.cpu.018.pb.gz
File: kube-batch
Build ID: 3224bdfdc94dfee3f4c2f15d26825527ae27817c
Type: cpu
Time: Apr 5, 2021 at 11:48am (CST)
Duration: 30s, Total samples = 290ms ( 0.97%)
Entering interactive mode (type "help" for commands, "o" for options)
(pprof) top 10
Showing nodes accounting for 200ms, 68.97% of 290ms total
Showing top 10 nodes out of 106
      flat  flat%   sum%        cum   cum%
      40ms 13.79% 13.79%       40ms 13.79%  runtime.usleep
      30ms 10.34% 24.14%       30ms 10.34%  encoding/json.stateInString
      20ms  6.90% 31.03%       70ms 24.14%  regexp.(*Regexp).tryBacktrack
      20ms  6.90% 37.93%       20ms  6.90%  regexp/syntax.(*Inst).MatchRunePos
      20ms  6.90% 44.83%       20ms  6.90%  runtime.epollwait
      20ms  6.90% 51.72%       60ms 20.69%  runtime.mallocgc
      20ms  6.90% 58.62%       20ms  6.90%  runtime.memclrNoHeapPointers
      10ms  3.45% 62.07%       30ms 10.34%  encoding/json.(*Decoder).readValue
      10ms  3.45% 65.52%       10ms  3.45%  encoding/json.stateEndValue
      10ms  3.45% 68.97%       10ms  3.45%  github.com/kubernetes-sigs/kube-batch/vendor/github.com/json-iterator/go.(*Iterator).ReadString
(pprof)
|
其中:
- flat:当前函数占用CPU的耗时
- flat%:当前函数占用CPU的耗时百分比
- sum%:函数占用CPU的耗时累计百分比
- cum:当前函数加上调用当前函数的函数占用CPU的总耗时
- cum%:当前函数加上调用当前函数的函数占用CPU的总耗时百分比
- 最后一列:函数名称
也可以通过list 函数名查看函数的信息
命令:
list func_name
 1
 2
 3
 4
 5
 6
 7
 8
 9
10
11
12
13
14
15
16
17
| (pprof) list ReadString
Total: 290ms
ROUTINE ======================== github.com/kubernetes-sigs/kube-batch/vendor/github.com/json-iterator/go.(*Iterator).ReadString in /home/wangb/projects/src/github.com/kubernetes-sigs/kube-batch/vendor/github.com/json-iterator/go/iter_str.go
10ms 10ms (flat, cum) 3.45% of Total
. . 10: c := iter.nextToken()
. . 11: if c == '"' {
. . 12: for i := iter.head; i < iter.tail; i++ {
. . 13: c := iter.buf[i]
. . 14: if c == '"' {
10ms 10ms 15: ret = string(iter.buf[iter.head:i])
. . 16: iter.head = i + 1
. . 17: return ret
. . 18: } else if c == '\\' {
. . 19: break
. . 20: } else if c < ' ' {
(pprof)
|
tree查看调用链
 1
 2
 3
 4
 5
 6
 7
 8
 9
10
11
12
13
14
15
16
17
18
19
20
21
22
23
24
25
26
27
28
29
30
31
32
33
34
35
36
|
(pprof) top
Showing nodes accounting for 200ms, 68.97% of 290ms total
Showing top 10 nodes out of 106
      flat  flat%   sum%        cum   cum%
      40ms 13.79% 13.79%       40ms 13.79%  runtime.usleep
      30ms 10.34% 24.14%       30ms 10.34%  encoding/json.stateInString
      20ms  6.90% 31.03%       70ms 24.14%  regexp.(*Regexp).tryBacktrack
      20ms  6.90% 37.93%       20ms  6.90%  regexp/syntax.(*Inst).MatchRunePos
      20ms  6.90% 44.83%       20ms  6.90%  runtime.epollwait
      20ms  6.90% 51.72%       60ms 20.69%  runtime.mallocgc
      20ms  6.90% 58.62%       20ms  6.90%  runtime.memclrNoHeapPointers
      10ms  3.45% 62.07%       30ms 10.34%  encoding/json.(*Decoder).readValue
      10ms  3.45% 65.52%       10ms  3.45%  encoding/json.stateEndValue
      10ms  3.45% 68.97%       10ms  3.45%  github.com/kubernetes-sigs/kube-batch/vendor/github.com/json-iterator/go.(*Iterator).ReadString
(pprof) tree ReadString
Active filters:
   focus=ReadString
Showing nodes accounting for 10ms, 3.45% of 290ms total
----------------------------------------------------------+-------------
      flat  flat%   sum%        cum   cum%   calls calls% + context
----------------------------------------------------------+-------------
                                              10ms   100% |   github.com/kubernetes-sigs/kube-batch/vendor/github.com/json-iterator/go.(*Iterator).ReadObjectCB
      10ms  3.45%  3.45%       10ms  3.45%                | github.com/kubernetes-sigs/kube-batch/vendor/github.com/json-iterator/go.(*Iterator).ReadString
----------------------------------------------------------+-------------
                                              10ms   100% |   github.com/kubernetes-sigs/kube-batch/vendor/github.com/json-iterator/go.(*Iterator).skipObject
         0     0%  3.45%       10ms  3.45%                | github.com/kubernetes-sigs/kube-batch/vendor/github.com/json-iterator/go.(*Iterator).ReadObjectCB
                                              10ms   100% |   github.com/kubernetes-sigs/kube-batch/vendor/github.com/json-iterator/go.(*Iterator).ReadString
                                              10ms   100% |   github.com/kubernetes-sigs/kube-batch/vendor/github.com/json-iterator/go.(*Iterator).skipObject.func1
----------------------------------------------------------+-------------
                                              10ms   100% |   github.com/kubernetes-sigs/kube-batch/vendor/github.com/json-iterator/go.(*frozenConfig).Unmarshal
         0     0%  3.45%       10ms  3.45%                | github.com/kubernetes-sigs/kube-batch/vendor/github.com/json-iterator/go.(*Iterator).ReadVal
                                              10ms   100% |   github.com/kubernetes-sigs/kube-batch/vendor/github.com/json-iterator/go.(*twoFieldsStructDecoder).Decode
----------------------------------------------------------+-------------
|
监控方式
如果你的应用程序是一直运行的,比如 web 应用,那么可以使用net/http/pprof库,它能够在提供 HTTP 服务进行分析。
如果使用了默认的http.DefaultServeMux(通常是代码直接使用 http.ListenAndServe(“0.0.0.0:8000”, nil)),只需要在你的web server端代码中按如下方式导入net/http/pprof
此方式适合测试一些服务进程的性能,当某场景触发时,通过接口采集性能数据,便于查看程序的动态性能。
如测试调度器在压力测试场景中的性能。采用此监控http方式,详细查看[pprof开启]
安装graphviz
graphviz是将结构信息表示为抽象图和网络图的一种方法。自动图形绘制在软件工程、数据库和网页设计、网络化以及其他许多领域的可视化界面中都有着重要的应用。
graphviz安装完成后,在后面使用pprof生成的测试profile,可以转成svg等格式(如调度图),进行可视化查看
graphviz下载地址
安装命令
 1
 2
 3
 4
 5
 6
 7
 8
 9
10
11
12
13
14
15
|
# Ubuntu packages*
sudo apt install graphviz

# Fedora project*
sudo yum install graphviz

# Debian packages*
sudo apt install graphviz


# Stable and development rpms for Redhat Enterprise, or CentOS systems* available but are out of date.
sudo yum install graphviz
|
测试graphviz是否安装成功
1
2
3
4
5
| [root@node61 ~]# dot -V
dot - graphviz version 2.47.0 (20210316.0004)
[root@node61 ~]#
[root@node61 ~]#
|
pprof开启
包pprof以pprof可视化工具所期望的格式通过其HTTP服务器运行时分析数据提供服务。通常,导入包只是为了注册其HTTP处理程序的副作用。所处理的路径都以/DEBUG/pprof/开头。
go语言提供包:
- runtime/pprof:采集工具型应用运行数据进行分析
- net/http/pprof:采集服务型应用运行时数据进行分析
如何使用pprof
导入pprof包
1
2
| // pprof
import _ "net/http/pprof"
|
这一句导致源码里面实际执行的是:
1
2
3
4
5
6
7
| func init() {
http.HandleFunc("/debug/pprof/", Index)
http.HandleFunc("/debug/pprof/cmdline", Cmdline)
http.HandleFunc("/debug/pprof/profile", Profile)
http.HandleFunc("/debug/pprof/symbol", Symbol)
http.HandleFunc("/debug/pprof/trace", Trace)
}
|
上面的url和处理函数都被注册到了http包的DefaultServeMux里面,所以要想使用这些url就必须使用DefaultServeMux来监听某一端口:
如果应用程序尚未运行http服务器,则需要启动该服务器。在导入中添加“net/http”和“log”,并在主函数中添加以下代码:
1
2
3
4
| // pprof
go func() {
log.Println(http.ListenAndServe("localhost:6060", nil))
}()
|
这里第一个参数可以是本机的任一端口,当第二个参数为nil时就使用http包的DefaultServeMux来监听并处理http请求, 或者当程序里面已经有自定义的ServeMux时,可以像上面的init函数那样把pprof的处理函数注册到自定义的ServeMux。
heap profile
1
| go tool pprof http://localhost:6060/debug/pprof/heap
|
30-second CPU profile
1
2
| # go tool pprof http://localhost:6060/debug/pprof/profile?seconds=30
go tool pprof http://10.151.11.61:39999/debug/pprof/profile?seconds=30
|
这个http请求会等seconds参数指定的秒数,这期间读取请求返回的二进制格式内容,我们把返回的内容保存为文件,假设取名为cpu.prof, 这个文件里面包含了程序收到请求后的seconds秒内运行占用CPU的情况。
接下来我们通过在命令行输入go tool pprof来查看cpu.prof:
这个命令会进入命令行交互,我们可以输入很多子命令来查看相关信息,最常用的几个子命令是:
该子命令会列出最耗时的N个函数调用,在输入top命令前输入cum或flat可以使得top列出的列表按cum或flat列排序,flat是单个函数自身(不计函数里面调用的其它函数)的耗时,cum是函数从进入到退出总的耗时。
如果要看某个函数具体是在什么地方耗时,可以使用list子命令查看:
1
| list func_name_in_top_list
|
该命令会显示耗时的代码和行号, 如果提示找不到source信息,可以在go tool pprof后面指定保存在本地的被profile程序的binary文件,并且这个binary文件要和生成profile文件的程序是在同一平台下编译的。比如在本地的Windows机器上远程profile linux机器上运行的go程序时,确保本地指定的binary是linux机器上编译的:
1
2
| go tool pprof mybinarypath prof_file_from_remote_host
go tool pprof mybinarypath https://myremotehost/debug/pprof/profile
|
为了更直观的看出热点函数的调用关系,我们更多的是使用svg和web子命令:
1
2
3
| ###svg > xxx.svg
##web
svg
|
svg命令会生成一个指定文件名的svg文件,web命令会生成一个svg文件并用浏览器打开这个文件,执行web命令前先确保安装了graphviz(brew install graphviz, 然后brew list graphviz查看安装位置并将安装位置的bin目录加到PATH),并确保svg文件的默认打开程序是浏览器。 通过web子命令在浏览器打开的这个svg文件非常有用, 可以清楚的看到耗时函数的调用关系图。
查看环境cpu profile命令
在环境中,获取cpu pofile命令,默认采集时长30秒
1
| go tool pprof http://10.151.11.61:8080/debug/pprof/profile
|
fetch完成后,会进入pprof,然后输入svg,(环境中使用web自动打开svg),导出xxx.svg文件,将该svg文件拷贝出来,使用浏览器打开即可。
1
2
3
4
|
type "help <cmd|option>" for more information
(pprof) svg
Generating report in profile001.svg
|
调度图
把上面的xxx.svg文件,使用浏览器打开,就能看到调度图,里面包含了各函数之间的调用性能
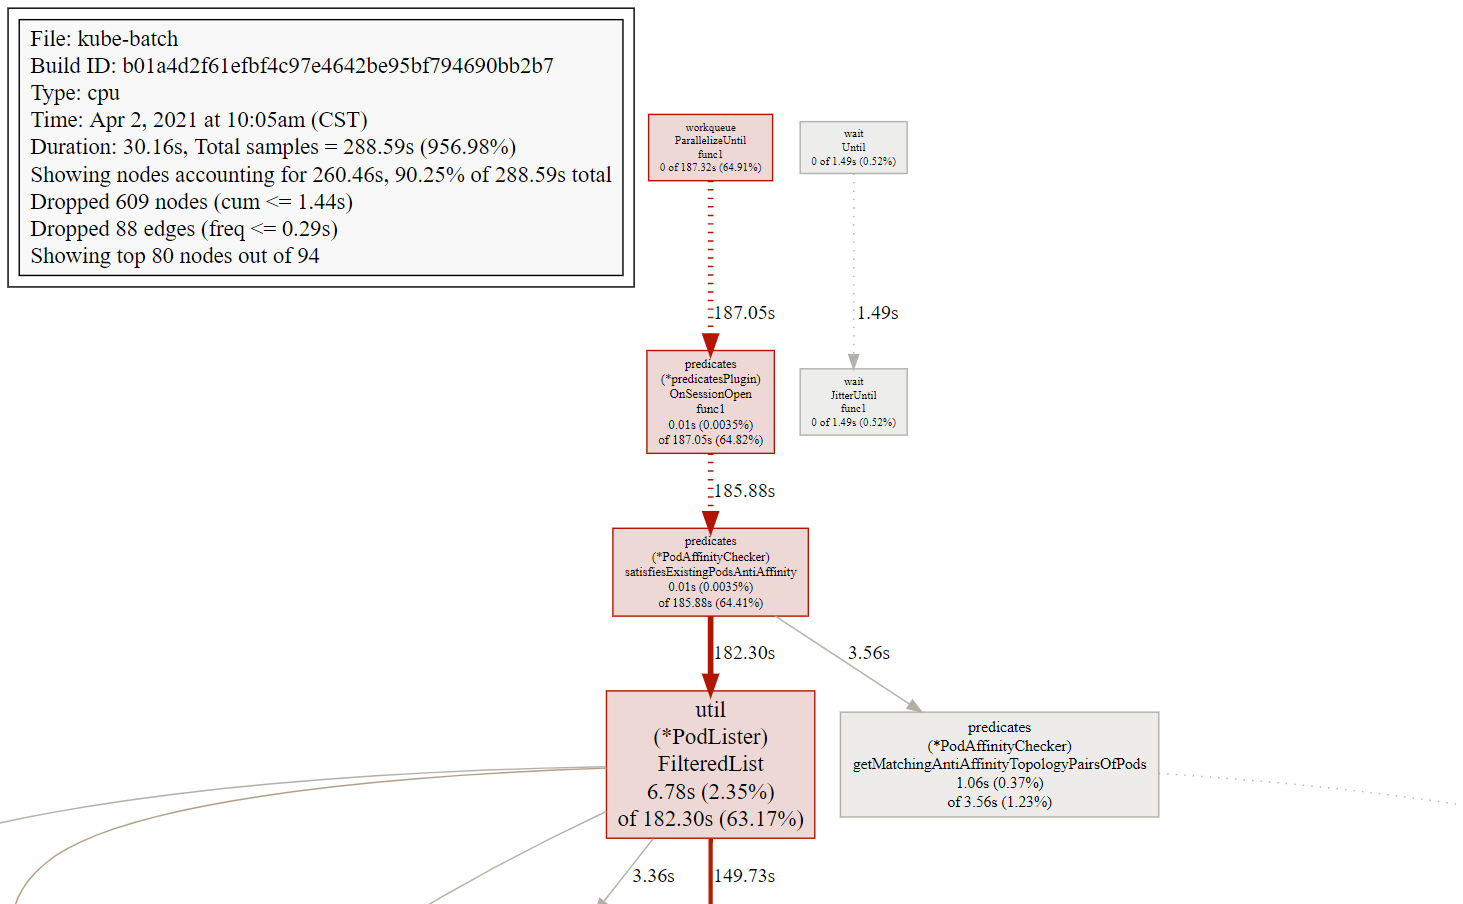
关于图形的说明:
- 每个框代表一个函数,理论上框的越大表示占用的CPU资源越多。 方框之间的线条代表函数之间的调用关系。 线条上的数字表示函数调用的次数。
- 方框中的第一行数字表示当前函数占用CPU的百分比,第二行数字表示当前函数累计占用CPU的百分比。
go tool pprof默认是使用-inuse_space进行统计,还可以使用-inuse-objects查看分配对象的数量。
goroutine blocking profile
1
| go tool pprof http://localhost:6060/debug/pprof/block
|
the holders of contended mutexes
1
| go tool pprof http://localhost:6060/debug/pprof/mutex
|
execution trace
该包还导出一个处理程序,该处理程序为“Go Tool Track”命令提供执行跟踪数据。收集5秒钟的执行跟踪
1
2
| wget -O trace.out http://localhost:6060/debug/pprof/trace?seconds=5
go tool trace trace.out
|
trace查看
trace获取
在环境中获取trace数据
1
2
3
4
5
| # kube-batch pprof
# http://10.151.11.61:39999/debug/pprof/
wget -O trace.out http://10.151.11.61:39999/debug/pprof/trace?seconds=10
|
或者直接本地通过浏览器访问http://10.151.11.61:39999/debug/pprof/ 获取trace数据。
trace分析
把环境中获得的trace文件,拷贝到本地,并输入如下命令
1
2
| # go tool trace trace.out
go tool trace trace
|
本地需安装有go环境,此时自动调用浏览器打开trace
1
2
3
4
5
| $ go tool trace trace
2021/04/05 12:10:17 Parsing trace...
2021/04/05 12:10:20 Splitting trace...
2021/04/05 12:10:21 Opening browser. Trace viewer is listening on http://127.0.0.1:50907
|
使用浏览器打开访问页面如下图
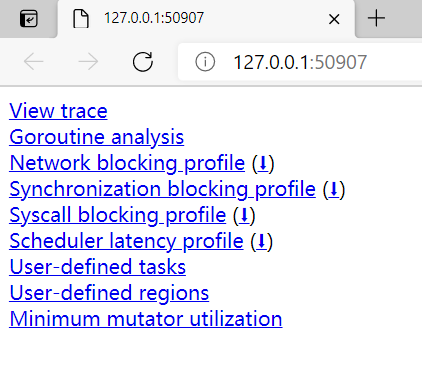
现在可以进行以下项分析
- View trace
- Goroutine analysis
- Network blocking profile
- Synchronization blocking profile
- Syscall blocking profile
- Scheduler latency profile
- User-defined tasks
- User-defined regions
- Minimum mutator utilization
常用的有:
- View trace
- Goroutine analysis
- Network blocking profile
- Synchronization blocking profile
- Syscall blocking profile
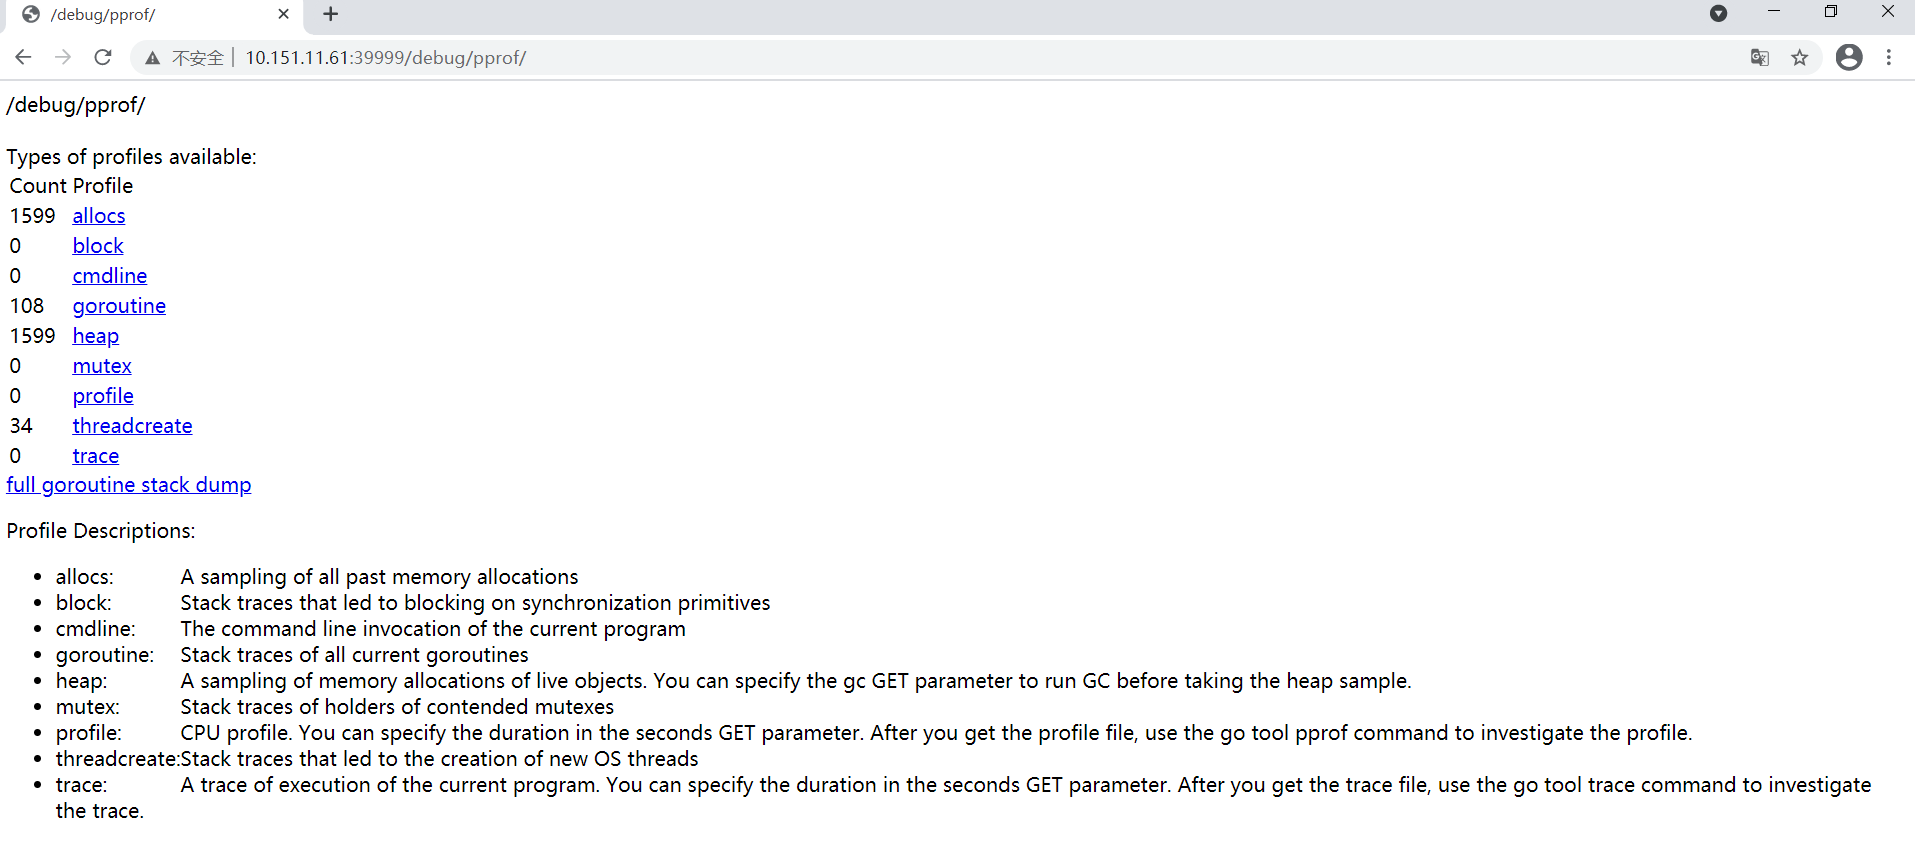
all available profiles
若要查看所有可用的配置文件,请在浏览器中打开http://localhost:6060/debug/pprof/。
1
2
|
http://localhost:6060/debug/pprof/
|
使用浏览器打开访问页面如下图
pprof包
pprof包介绍见下链接
pprof包详细内容
实例分析
问题:k8s部署的一个go程序组件的性能在压测条件下,性能指标(吞吐量、延时)表现不好
由于是底层程序组件,不易采用日志打印方式来定位问题原因,考虑go pprof分析。
结合程序运行cpu和内存情况,发现内存使用正常,但cpu利用率很高。重点分析cpu profile
pprof配置
pprof server config
在9999端口开启pprof服务
1
2
3
4
5
6
7
8
9
10
11
12
13
14
15
16
|
// main.go
// pprof
import _ "net/http/pprof"
func main() {
// ...
// pprof
if s.Profiling{
go http.ListenAndServe(":9999", nil)
}
// ...
}
|
pprof service
编辑 service.yaml,使得环境node的39999端口映射到待调试k8s程序
1
2
3
4
5
6
7
8
9
10
11
12
13
14
15
16
17
18
19
20
21
22
23
24
| apiVersion: v1
kind: Service
metadata:
namespace: kube-system
name: kube-batch-prometheus-discovery
labels:
k8s-app: kube-batch
spec:
selector:
k8s-app: kube-batch
#type: ClusterIP
type: NodePort
ports:
- name: http-metrics
port: 8080
targetPort: 8080
protocol: TCP
# pprof port setting
- name: http-pprof
nodePort: 39999
port: 9999
targetPort: 9999
protocol: TCP
|
重启程序和服务,运行压测,待场景触发时,浏览器访问http://node_ip:39999/debug/pprof/
或者 通过命令行方式获取pprof文件
1
2
3
4
5
6
7
8
9
10
11
12
13
14
15
| # http://10.151.11.61:39999/debug/pprof/
## trace文件
wget -O trace.out http://10.151.11.61:39999/debug/pprof/trace?seconds=10
## cpu profile,默认30s,进入pprof后,输入svg,导出svg文件
go tool pprof http://10.151.11.61:39999/debug/pprof/profile
#type "help <cmd|option>" for more information
#(pprof) svg
#Generating report in profile001.svg
|
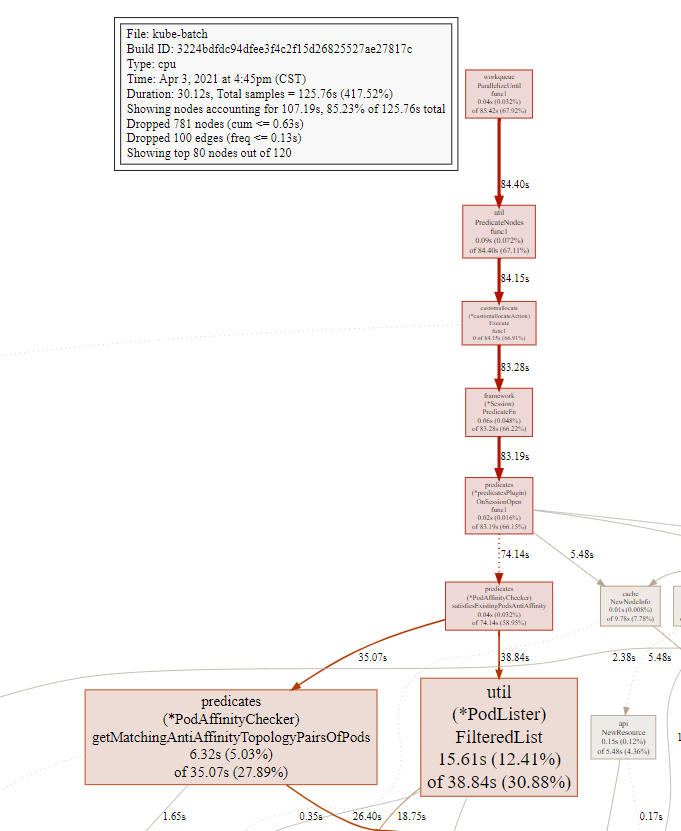
调度图
浏览器打开之前导出的svg文件,如profile001.svg
可知predicates协程的FilteredList函数cpu占比较大,处理耗时较长。需要进行优化。
trace图
优化前,协程运行和执行时间
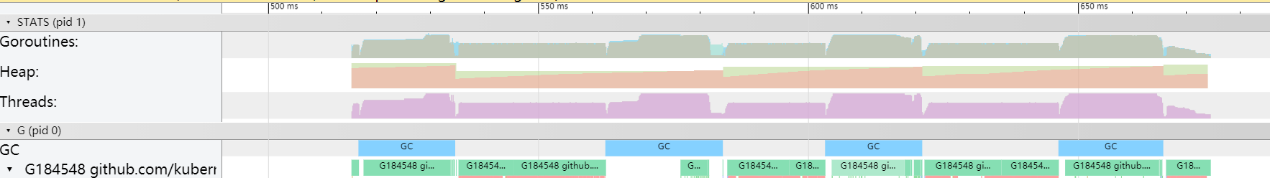
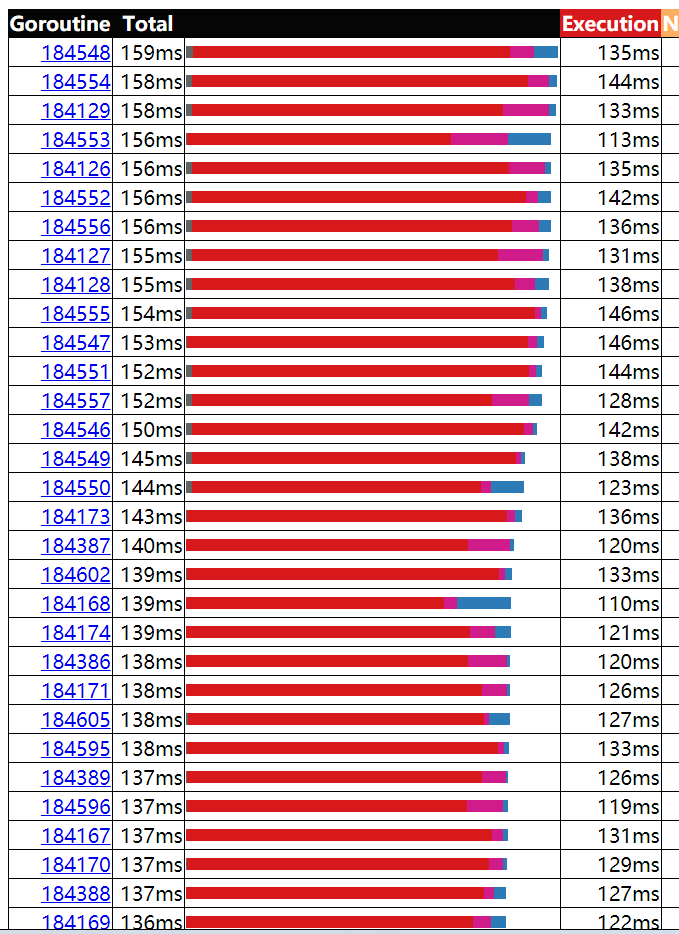 此时执行时间基本上都在130ms左右,耗时较长,影响性能。
优化后的pprof
调度图
函数列表信息
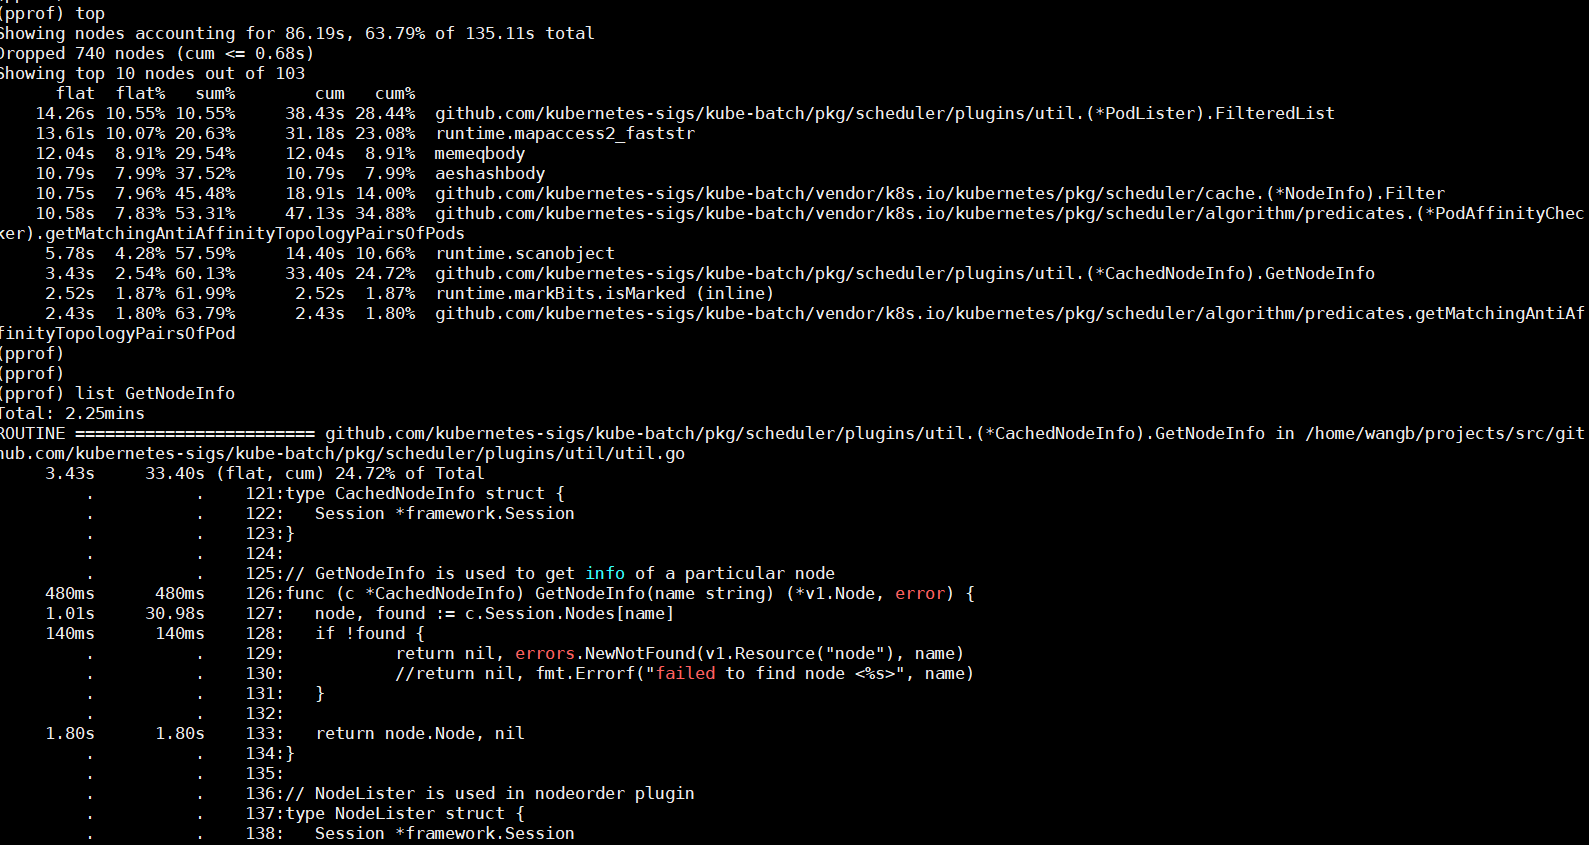
对比优化前性能得到改善。
trace图
协程运行和执行时间
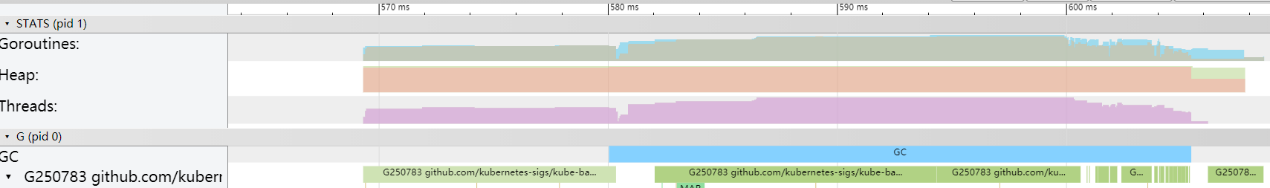
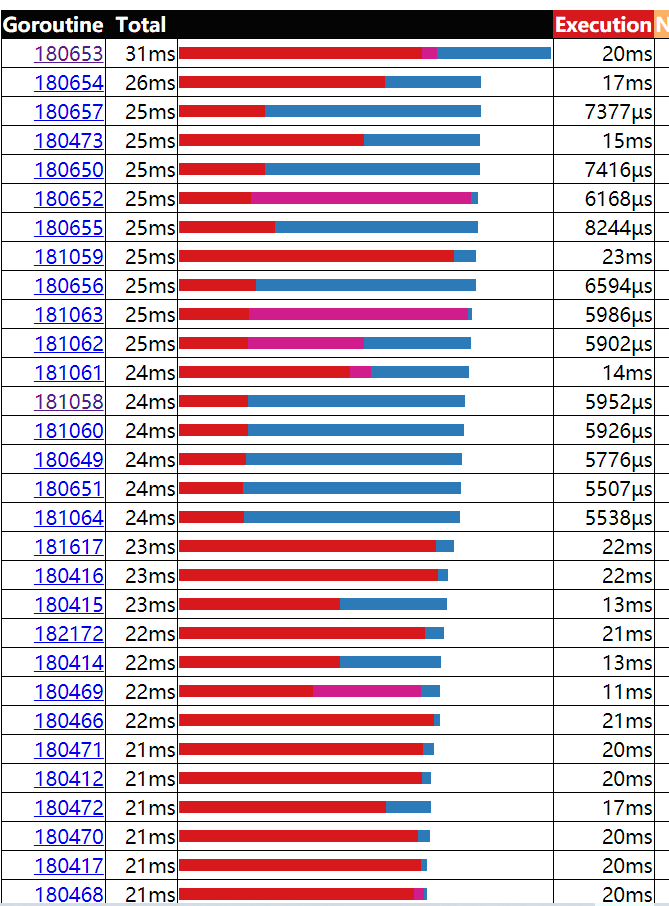 最后优化结果性能,执行时间基本上都在20ms以内,程序的性能经优化得到改善。
参考资料